
Cloud Analytics for Health Information
Daily data cube rebuilds replaced with on demand reporting on a HIPAA compliant Azure data platform, adding peer benchmarking for providers.
Data & AI
We connect data sources, build analytical models and create reporting that helps teams answer defined business questions.
Built around your needs

Illustrative work context.
Reports may use different definitions, arrive too late or leave important questions unanswered. We help teams identify the decisions that need support and the data available to inform them.
We review source quality, metric definitions and how data is collected, transformed and reported. We distinguish observed patterns from assumptions and check the limitations of the available information.
We build data pipelines, models and reporting around agreed questions. Validation, documented definitions and ongoing ownership help teams interpret the results and keep the reporting useful.
What the engagement can include.
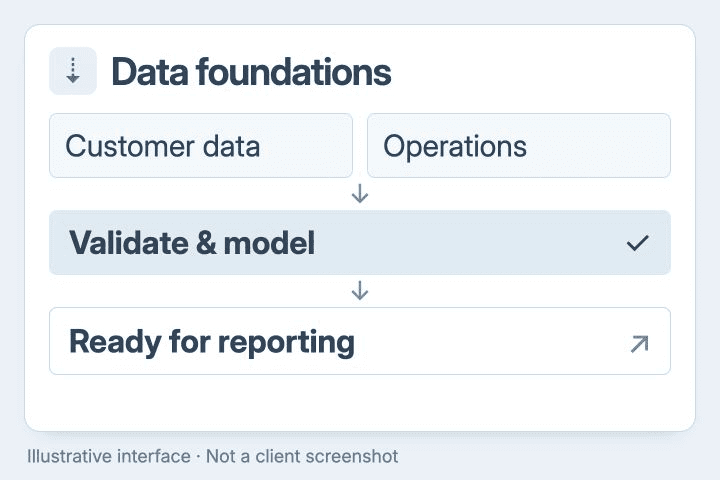
We connect source systems, prepare and model the data, and validate it before it reaches applications or reports. Pipelines and clear ownership make the path from source to use easier to operate.
We analyze revenue, cost and operational data to investigate changes in performance. The analysis considers customer behavior, pricing and process constraints, with the limits of the data made clear.
We study how users interact with products and services, from first touch to repeat usage. The goal is to understand what drives engagement, drop off, and lasting value.
We build forecasting models using historical data and known constraints, with assumptions and uncertainty made clear.
Published examples of data pipelines, reporting foundations and automated recommendations. Clients are anonymized and outcomes are stated as published.
Daily data cube rebuilds replaced with on demand reporting on a HIPAA compliant Azure data platform, adding peer benchmarking for providers.
Manual promotion building replaced by an automated, machine learning supported offer workflow delivering recommendations in near real time.
We start by identifying the decisions this analysis needs to support. This keeps the work focused and prevents data overload.
Data sources are reviewed, cleaned, and aligned. Inconsistencies are fixed so results can be trusted.
Patterns are tested against multiple angles to avoid false conclusions. Assumptions are challenged early.
Findings are shared with context and recommendations. The goal is clarity, not just charts.
Begin with a business question, agree the definitions and build a reporting path the team can maintain.
Ecommerce
Compare channels, purchases and margins with consistent definitions.
Analytics can combine order, campaign and customer data to examine patterns. We document attribution assumptions, data gaps and the limits of conclusions drawn from the available records.
Healthcare
Bring validated sources into a shared reporting model.
Healthcare reporting may combine several operational data sources. Validation, access requirements and metric definitions need clear ownership.
SaaS
Track customer activity against agreed measures.
A reporting model can connect subscription and product usage data to examine retention, churn and expansion. Definitions and time periods need to stay consistent so teams can compare results.
Listed to show fit with existing environments. Tools are chosen per project; a listing is not a partnership claim.
Tell us about your data sources, reporting needs and the decisions you want to support.